Continuing our miniseries about statistics in floorball, here’s part 2. We started off with an extended introduction and now, David Schenker would like to give you some more illustrated examples.
How is the image below helping you a in floorball game, one might wonder. It’s not clear at all what all dots mean and how you can learn from it. However, the analytical software Performasports has a way for it, and Schenker will explain it (text continues below image):
By: David Schenker (Floorballytics)

This is what a tracked game looks like, as explained in article 1. The colours indicated the different events, they can then be filtered by event or player. This can also be done across multiple games. Per game I tracked somewhere between 250 and 350 events, this all depends on the depth you want to go into.
Try Performasports for free – Click here

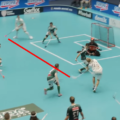
Here the events are filtered so that only the blocked and missed shots are shown from this particular game. It’s from one team, which explains the reason all shots are on the same half.

This shot map indicates the locations, from which a player scored across all games played. To get more information, more games need to be tracked.

In yellow, you can see all shots on goal from a particular player across the whole season. As you can see, the filters allow the coaches and players great insights into event-specific patterns from a single player or the whole team in a single game or across multiple games. The shot from own half was taken in the 70th minute: probably the last second of overtime!

Video footage can also be reviewed by players and coaches very easily. Filters also allow players to find video clips by event type and/or game selection. Each clip takes you directly to the action that happened in that game.
FloorballToday offer: Performasports gives the opportunity to try their software for three weeks – for free. Click here for a direct link.
Later this week, this series will continue for its final part, in which we show more examples of how you can use Performasports software to track all events during a game. Be warned: it might get a bit technical!
Questions and/or feedback? Send Floorball Analytics a message on Twitter!


No Comments
Leave a comment Cancel